
Business Intelligence solutions
in the UAE.
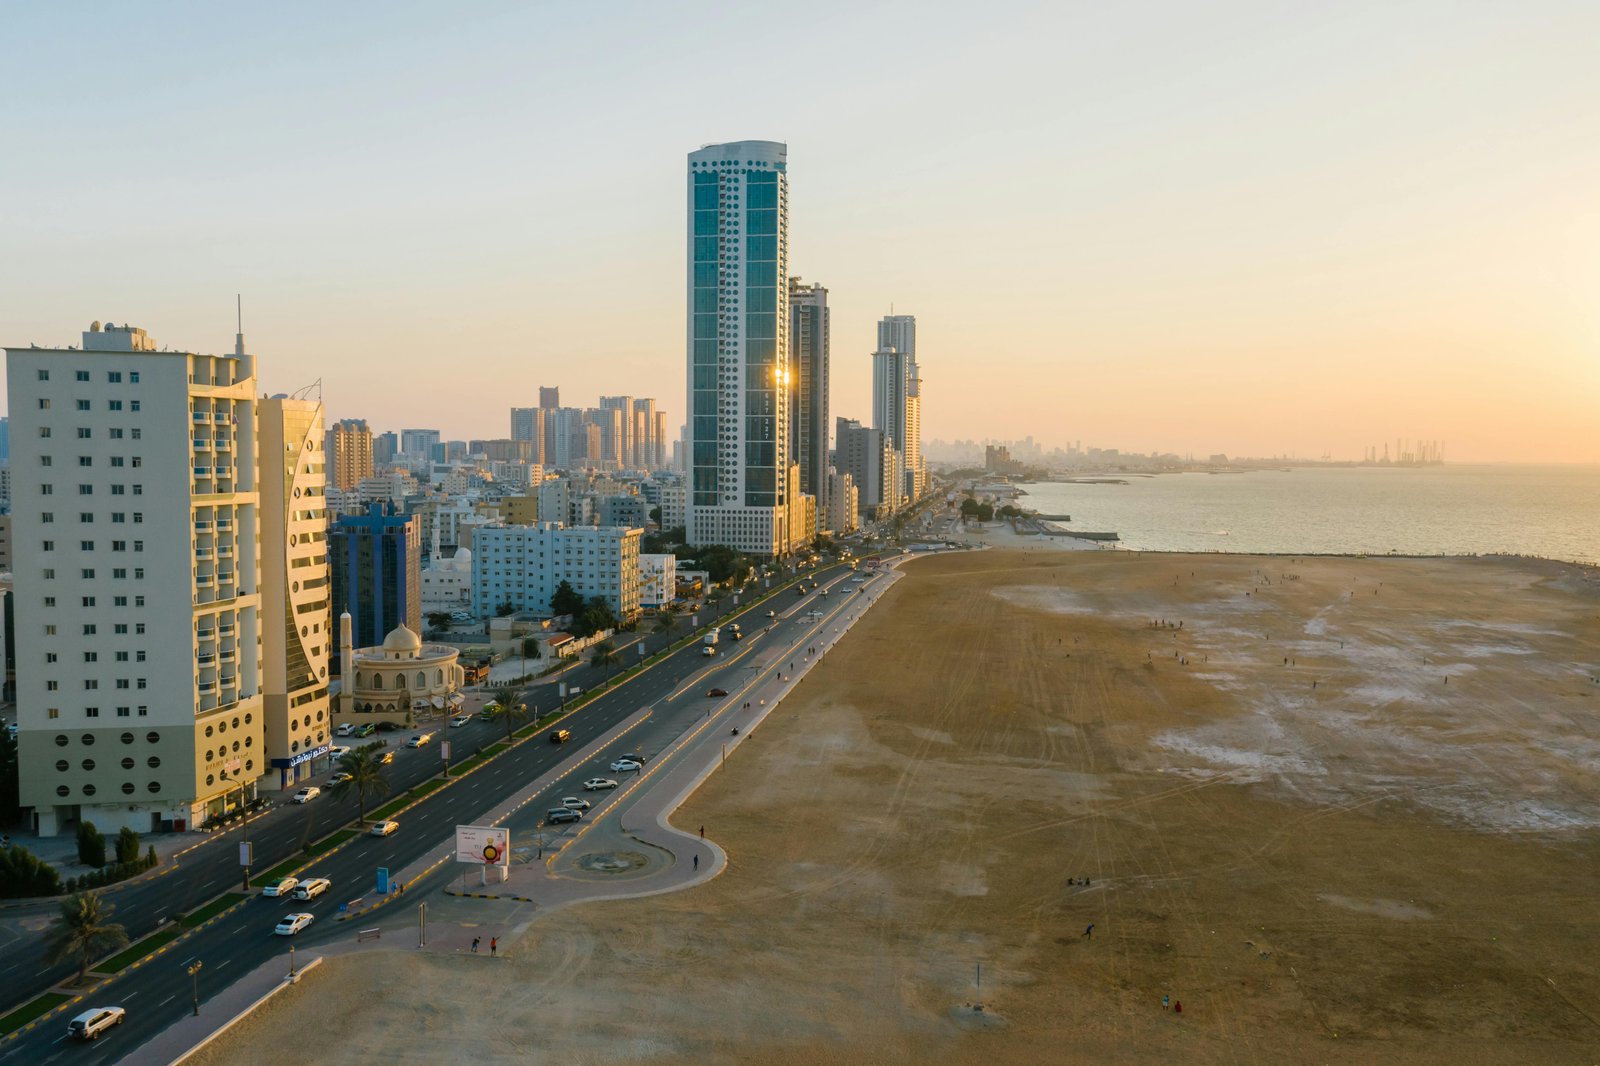
Expert Power BI analytics, business formation, and full-service consulting across Dubai, Abu Dhabi, Ajman, and Ras Al Khaimah. Your success is our mission.
Our Services
We provide end-to-end solutions for your success in the UAE market.

Business Formation
Complete UAE company setup across all emirates. Mainland, Freezone, and Holding structures with expert guidance.
Learn More
Power BI & Analytics
Advanced business intelligence solutions with interactive dashboards and predictive analytics.
Learn More
Accounting Solutions
Intelligent automation systems with AI-powered transaction processing and reporting.
Learn More
Financial Planning
Strategic financial planning and advisory services for sustainable business growth.
Learn More
Property Liquidity
Cross-border property optimization and liquidity solutions for maximum returns.
Learn MoreUAE-Wide Coverage
Comprehensive business services across all major UAE emirates

Dubai
Business setup in the world's leading commercial hub

Abu Dhabi
Capital city advantages with strategic positioning

RAK
Cost-effective freezone solutions with flexibility
Ajman
Emerging business destination with growth potential
Dubai
Business setup in the world's leading commercial hub
Abu Dhabi
Capital city advantages with strategic positioning
RAK
Cost-effective freezone solutions with flexibility
Ajman
Emerging business destination with growth potential


Zoho
Choose the right platforms to run your business: Zoho for finance and operations, Power BI for analytics, and HubSpot for growth. We configure, automate, and connect these tools around your UAE business goals.
Ready to Start Your UAE Business Journey?
Get expert guidance and comprehensive support for your business formation and growth in the UAE. Schedule your free consultation today.